Tuesday, December 21, 2010
Observe & Trade
Waiting for the regular market trading time.
Shown previously are traded charts in the Globex trading time.
I'll compare how the regular and the Globex trading time differs.
Certainly, trading in the regular market is very volatile and unpredictable.
In Globex, not much participants but very "boring".
But comparing both, I prefer the latter cause that is where the sure money is.
Trading is to make money anyway, so better to get bored!
Observe & Trade


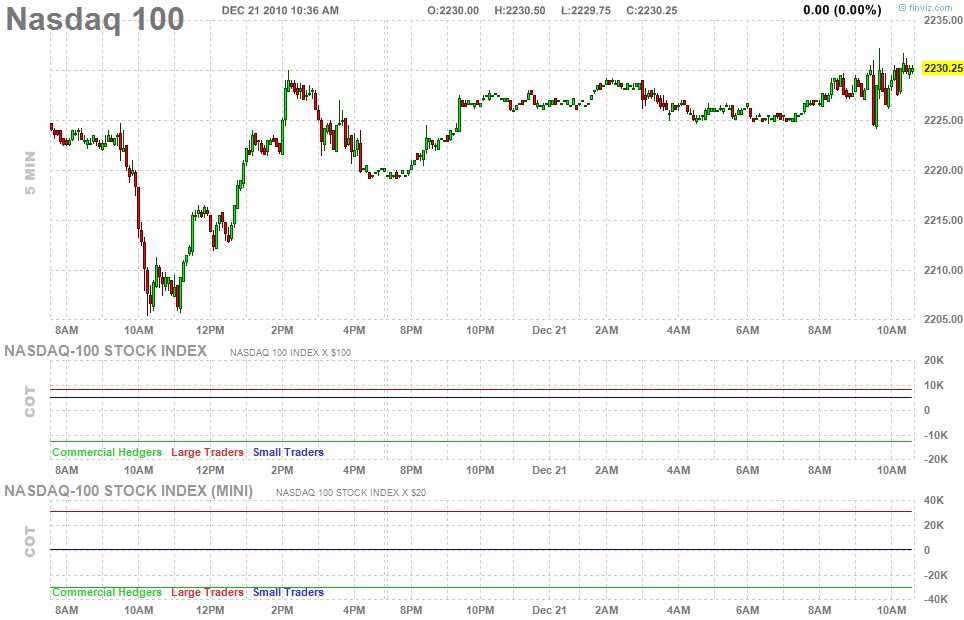
Shown in here from the two 5-min. chart what I was pointing out from my previous two post.
The TF moved by two points. Good for $200.00 bucks for a one contract.
YM moved by 20 points. That's a $100.00 bucks for a contract trade.
Very boring trading time due to "long waiting and no volume trade".
But it's worth, no noise!
Is trading during Globex time better that the market time?
Looks like it but needs a lot of coffee to stay awake!
Observe & Trade

YM is consolidating tighly (in the Globex) on small bars.
Seems ready to pop up before the open.
It is sitting above 20MA from my 5-min. real time chart.
Observe & Trade

TF market is consolidating tightly in the Globex as of this time.
All four main core indexes are moving upwards smoothly.
Looks like same scenario like yesterday.
I am particularly watching/trading TF partly because a one point move can make fast money ($100.00 for a contract).
That's why for a small move like that mean a big business for "us (me)" small retail traders.
Monday, December 20, 2010
Observe & Trade


Was not able to monitor the whole market up to the close today due to some personal issues.
Anyway, as I was looking all the four core charts today, I may conclude that there were lots of opportunities to trade.
It's just that I was not in the market from start to finish.
I missed a lot of opportunities.
Anyway, no excuses.
As they said, if you missed the first couple of hours in the market..."it's your fault"!
Observe & Trade
It's a hard sell off in the market.
Looks like it won't recover from hereon.
Might stay idle (flat) for a while, maybe up to the close.
Though TF and NQ already risen from the "cave", but it is doubtful to make a move.
Might as well stay on the sideline.
Looks like it won't recover from hereon.
Might stay idle (flat) for a while, maybe up to the close.
Though TF and NQ already risen from the "cave", but it is doubtful to make a move.
Might as well stay on the sideline.
Observe & Trade

The market went up during the Globex time (the "almost" 24 hour futures trading).
And from that time, all the four instruments (ES, YM, NQ, TF) went up smoothly.
Then in the open, the participants took time to make profit.
It's a sell off!
Maybe due to the impending holidays.
I can see from the chart in the TF, I mentioned earlier it is consolidating.
From there, it went up smoothly till the regular open.
If it was bought at 775.00 then sold at 780.00, that's a 5 points gain ($500.00)
That is if you traded in the Globex time.
Right now, not much to analyze because it's a sell off.
Unless you shorted in the open, but that's a little bit risky to my opinion.
Sunday, December 19, 2010
Observe & Trade
Futures market are down as of this moment.
We'll see if the trend continues till the open.
Futures market starts to open around 4:00 pm. est. Sunday.
Watching TF market. Looks like it is now consolidating.
We'll see if the trend continues till the open.
Futures market starts to open around 4:00 pm. est. Sunday.
Watching TF market. Looks like it is now consolidating.
Some notes on the e-minis
As I am going to show some trade ideas in real time here in my blog possibly by tomorrow.
Just to point out some things to know about the e-mini (electronic miniatures) futures trading.
These four indexes are the ones that I am going to find and form trading ideas in real time.
Namely, the Dow Jones 30 which as you may know comprises the main leading companies. They are the movers of the market. In the e-minis, the symbol is YM. It moves in the increments of one point, which equals to $5.00 per contract. So if the YM moves by 50 points, that's $250.00 bucks profit for one contract.
For the S&P 500, ES in the e-mini futures. It moves in the increments of 0.25 points. That's equal to $12.50 per contract. Or $50.00 for a full one-point move. So if the ES moves my 5 points, that's $250.00 profit.
For the NQ (Nasdaq), it moves in the increments of 0.50 points which is equals to $10.00 per contract. For a full point move, that's $20.00. So if the NQ moves by 10 points, that's $200.00.
For the TF, Russell 2000. It moves in the increments of 0.10 points, equals to $10.00 per contract. For a full point of move, that's $100.00. If the TF moves by 5 points that's $500.00 bucks.
So these are the five instruments I am going to show in real time if they have a potential to trade.
Going to observe the market's action in real time until such a time I can find and form trading ideas to get involved. That's how in trading is all about, Observe and Trade!
An Idea
This idea just pop up to me lately and decides to put in here.
It's just that been a while putting some trade ideas here in my humble blog and wants to do some extraordinary task.
My idea is to experiment with few interested individuals who are still on the stage of learning (or the amateur ones) in trading the e-mini futures.
My idea or project is to have a group of interested individuals to trade in real time.
There is of no charge on this, it's just for collaboration how to become a better trader.
But I cannot be responsible for the losses, I will just give my trade ideas or opinion how to get into the trade.
It's all up to the interested individual to determine if my idea make sense (to him/her), but I will make my justification why that kind of trade idea make sense at that time.
This is still in the planning stage and I still have to finalize how I'm gonna set it up.
But I want to find out first if there are some few individuals who are interested.
I am only looking for at least three or five open minded individuals who are committed in learning how to trade the e-minis.
The instruments to be traded are the ES; YM; NQ; and the TF.
I just wanna' make it clear that there can be no trade everyday, if there is probable setup to trade, that's the only way we're going to participate in the market.
It's a participation of all in the group, it's a group trading ideas.
But I will be the one to call the shots.
So for those who are sincere in learning how to trade the e-minis and are interested, drop me a mail at *(see note below).
This is an experimental idea and this is voluntary.
PS.
*NOTE: I am correcting myself on this. I won't be looking for just a few. I will just post my trade ideas in real time here. So no more/need to contact me.
Saturday, December 18, 2010
Observe & Trade


Showing some similarities from SPY and the S&P 5-min charts.
They move mostly at the same time.
Trading them both especially in the e-mini (ES) can give you an edge rather than trading individual stocks.
Notice the previous last hour of trading and the first few hours into the open, it's a seesaw battle.
But after some selling and buying pressure, it settles down and started consolidating.
That's where the best location to enter a trade.
The advantage of trading the e-minis as compared to individual stocks is the absence of market maker (the middleman) that sets the price.
In the futures, there's no problem filling the order, it can buy/sell the price at the market with no marked-up.
And the execution is right on real time.
Friday, December 17, 2010
Observe & Trade

A vertical leap from Russell 2000 (TF).
With the last two lower high coupled with the ascending 20MA, it leaps vertically from thereon.
It can also conclude prior to the opening from the previous last hour, it kinda' form a box.
And also the S/R level make sense to consider.
Observe & Trade
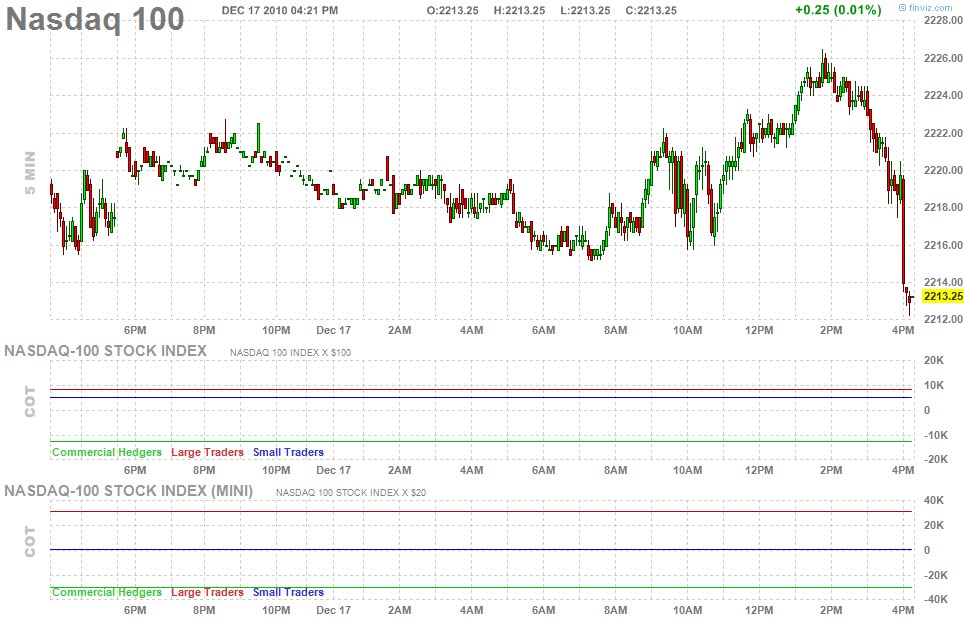

As I posted earlier that QQQQ (NQ in e-mini) has the probability to breakout.
And I was right!
As I mentioned, it formed a "W" pattern and it consolidates after (in between 54.56 - 54.58).
This is the kind of pattern that is a sure fire to trade.
You can enter at 54.56 and exit at 54.66 for a gain of just a mere +$0.10 per share.
But if you trade this in the e-minis, you can enter at 2222.00 and can exit at 2226.00 for a gain of 4 points.
NQ moves in the increments of 0.50 points at $10.00.
So for a gain of 4 points, that is +$80.00 for a contract.
Not bad for 30 minute "job"!
Observing

Watching this QQQQ chart (NQ from e-mini) formation on a 5-min. frame and I can conclude it is forming a "W" pattern.
Meaning, it has a tendency to go higher.
It may consolidate for a while but there is probability it might rally.
As Observed

Reading stock market news today from Yahoo and found this interesting attached picture from the subject I was reading.
The caption mentioned that this one in the photo traded the BA shares and had some issues with her trading transactions.
But my observation on this is how can she (he) become a good trader by just trading like that. I mean the setup where she's at.
Does she trade from the Starbucks coffee shop?
Well, no wonder the caption says, "this Amateur Trader"...., it really speaks what's in the picture.
Observe & Trade


A drop in the open from the two main index markets.
Selling in the open can make you a fast money.
It's the reverse movement from yesterday's action.
But there is no surprise on this, it's Friday (traders profit day).
Observing the market action can give us an edge.
That's the only way we can participate from the world of the Streeters!
Thursday, December 16, 2010
Observe & Trade


Nice rebound today from the three core index market.
The market went down after the open but came back roaring after a couple of hours into the trading.
Notice the similarity of the pattern.
If one goes up, they will go up almost at the same time.
That's the advantage in trading the e-minis.
Just monitor to four index market and you can make a sure profit.
But trading is not just like that, don't trade just for the sake of trading.
Timing is important and pattern recognition is a must.
No confirmation, no trade!
Observe & Trade

Showing a 2-min. chart from DIA (YM in e-mini futures).
It open below but turn to bullish mode after a couple of hours into the trading.
In trading, the first hour is the volatile part.
You can notice, the bears and the bulls are tagging each other until the bulls overcome the battle.
The safe entry is at 114.75 with the ascending 20MA as the confirmation.
Exit at 115.15 for a gain of +$0.40 per share.
Wednesday, December 15, 2010
Observe & Trade


The market made a dramatic "u" turn today to a bullish mode.
The three core index charts shows how they reacted simultaneously.
Trading them at the open can make you a fast money.
They can be relayed upon to the e-minis.
Monitoring these core index in a multiple screen can give you an edge in your trading.
Observe & Trade


As observed from these two chart in reference to the time frame.
You can see the difference how you can make a best setup (trade).
Using multiple time frame plays a big difference especially if you are a short term trader.
Comparing the one-min. and the two-min. time frame, you can easily spot when and where you can enter and exit.
In this probable trade, referring to the 2-min. chart as your base of recognition, you can conclude that you can short it from the pointed area.
And your best entry can be based from the one-min. chart that specifies clearly, in this case at around 3:15 pm. est. or at the price of 54.48 (the one under the descending 20MA).
Using multiple time frame can make you an "edge" in trading.
As they said in trading, if you don't know your "edge", you don't have one.
So in trading, know your "edge"!
Tuesday, December 14, 2010
Observe & Trade

Showing this 5-min. chart from Russell 2000 (TF), one can easily observe that this is a candidate for a short trade.
From the previous close, it opens up but stay below the pivot from thereon until it offers a short confirmation two hours before the close.
Monitoring the market the whole trading day needs a lot of patience, that's how in trading.
Monday, December 13, 2010
Observe & Trade

As observed from this 5-min. chart from Russell 2000 (TF), a low risk short trade is probable.
From the previous trading closing area (the previous arrow), and from the opening with a new high of 799.50 points.
By observing this chart pattern and by combining the previous closing chart, you can conclude that this is an HS pattern.
Likewise the descending 20 ema is a short trade confirmation, plus the previous close was broken at the last hour of trading.
By taking a last hour short trade is a sure fire to bank some money (777.00 - 773.00 = 4 points). TF moves 0.10 points per $10.00, that's +$400.00 bucks profit.
Not bad for the last hour trade.
As the great trader say, "waiting and sitting" coupled with Observing is the way to Trade!
Observe & Trade

Almost flat market day today, and this 5-min. chart from QQQQ which is identical to NQ from the e-minis shows a short trade at the last hour.
By observing the pattern one hour or two before the close, you cannot make a conclusion where it is heading.
But the 20 ema is descending, so the confirmation is to short this index with a tight stop.
NQ moves $10.00 per o.50 points, so if it moves 10 points, you have a gain of 20 points for a profit of $200.00.
Sunday, December 12, 2010
Saturday, December 11, 2010
Observe & Trade

Showing the trade completion of Russell 2000 (TF) today from this 5-min. chart.
Entry at 768.60 points on long.
Exit at 777.00 points for an +8.4o points gain.
TF moves $10.00 per 0.10 points, that equals to +84.00 points.
That amounts to $840.00 for a one (1) contract trade.
Not bad for a one contract trade!
Friday, December 10, 2010
Observe & Trade

After intense battle in the opening today, the market settles a bit and this chart from Russell 2000 offers an entry for long.
It's a profit taking day (today, Friday) that's why traders wants to go home with profit.
ES and YM were so volatile early as well as NQ.
TF not much, maybe few participants are still trading (playing) this instrument.
Looks like TF is more quiet to trade than the three.
Thursday, December 9, 2010
Observe & Trade

Nice pattern from Dow-30, similar to e-mini YM.
Not much direction from the market today except this pattern that I created through my "art of trading"!
Observe & Trade

A boring market observation today and not much you can do about it except just to draw your own conclusion or "imagination" how the market behaves.
All I can do is just to draw my own "imagination" or creativeness how the market "behaves" today.
It's all for every traders today to draw their own conclusions.
But for me, this 5-min. chart from Russell 2000 (TF) is all I can make a conclusion.
Just make your own guess, I have mine!
Wednesday, December 8, 2010
Observe & Trade

Was wrong to make an "assumption" today about the market direction, that's why in the market nothing is predictable - so better not to make any conclusion about the market!
But sometimes as humans, we make some kind of "abnormal" presumptions, that's why there is trading in the market.
If no one has conclusion, we cannot make a trade, but it would be better just to keep it to ourselves (traders).
That's why I refrain from making such "prediction" if I have to, I always based my observation about the market through charts formation, not from the news.
Anyway, the market "zag-zig" today!
I call it zag-zig because of its abnormal movement as shown from this 5-min. chart from SPY (ES).
Looks like the market is taking some kind of "stockpiling", ready to burst anytime.
just Observe and Trade
Not much to chew about today with market moving indicator unless there are some news coming from the government, but other than that it will be a quiet trading day today.
The futures is on steady upwards as I compose this post, I think it will move more (slowly) on the way up.
It might be "good" to trade today after the open settles.
Trading by looking at the charts or observing its movement is the only way to have a good idea when to get in, rather than relying from different kind of sources.
just Observe and Trade!
Tuesday, December 7, 2010
Observe & Trade


A double top formation was observed today from the three core index markets.
Notice their similarity from the 5-min. chart, an "M" form like pattern.
They are identical to the e-mini futures of YM, ES and the NQ.
If you are just paying attention with their movement today, you can create your own conclusion with the above charts.
You know in trading, they call it an "art", so these are one of those.
Observe & Trade

Shown in here the 10-min. chart from Russell 2000, TF from e-mini futures.
If you are are still holding it since last Friday, it continues to surge.
Today, Tuesday it skyrocket due to tax credit extension from the government.
What a nice profit the past two days and today!
If you are are still holding it since last Friday, it continues to surge.
Today, Tuesday it skyrocket due to tax credit extension from the government.
What a nice profit the past two days and today!
Sunday, December 5, 2010
Observe & Trade: Current Portfolio
This is the link to my current portfolio that I play when the market tank in December or November 2008. Click the link how it is performing now: Yahoo! Finance - Portfolios
Observe & Trade

What a nice chart entry from Russell 2000, equivalent to TF in the e-minis.
Spotting this formation can make your whole week of waiting for the right trade in just one day, Friday.
That's how in trading, you don't need to trade everyday, only fools do.
Trading is waiting for the right timing!
Subscribe to:
Posts (Atom)