The History Of Capitalism: From Feudalism To Wall Street
The roots of what are now commonplace activities - such as buying stocks,
bonds, and even things like applying for a loan or balancing a portfolio - is
the "evolution" of the various economic systems that have supported them. The
development of economics across time and continents is neither uniform, nor
complete. This article will focus on the systems that have led to our current
Wall Street arrangement.
Tooth, Nail and Plants
In the black hole known as
pre-history, humans established a complex system of community that includes
elements of labor, reward and trade. This eventually included the domestication
of plants and livestock, furthering the scope of tradeable goods as well as
tying people to the land so economies could develop. The uneven development of
ancient economies suggests that many systems were attempted, but the profusion
of empires suggests that the rule of powerful elite was the most successful in
the early going.
The Spaces Between Empires
The most telling fact about
humanity in the ancient world is that when the external controls of a ruler were
removed, people reverted to subsistence farming. Although there is only one
official dark age in the history text, the disconnected ancient world used to go
through dark ages much like the blackouts and brownouts that ripple across
energy hungry states. In these dark areas, the people went back to securing
enough food for themselves and surviving until the next powerful figure came
along to claim them as his own.
Feudalism
Up until the 12th century, less than 5% of the
population of Europe lived in towns. Skilled workers lived in the city but
received their keep from feudal lords rather than a real wage, and the farmers
were essentially serfs for landed nobles. It took the Black Plague, one of the
most devastating pandemics in human history, to shake up the system
significantly. By killing scores of people in both town and countryside, the
various plagues of the dark ages actually created a labor shortage.
Nobles fought to hire enough serfs to keep their estates running and many
trades suddenly needed to train outsiders, as entire guild families were wiped
out. The advent of true wages offered by the trades encouraged more people to
move into towns where they could get money rather than subsistence in exchange
for labor. As a result of this change, birth rates exploded and families soon
had extra sons and daughters who, without land to tend, needed to be put to
work. Child labor was as much a part of the town's economic development as
slavery was part of the rural life.
Mercantilism
Mercantilism is now known as an attempt to
create trade imbalances between nations, as well as between colonies and their
imperial rulers, so that one nation prospers at the cost of others. The word
"mercantilism" also has a less known usage, which simply means the principles
and methods of commerce. Mercantilism started as trade between towns, but it was
not necessarily competitive trade. Originally, each town had vastly different
products and services that were slowly homogenized by demand over time. After
the homogenization of goods, trade was carried out in wider and wider circles:
town to town, county to county, province to province, and, finally, nation to
nation. When too many nations were offering similar goods for trade, the trade
took on a competitive edge that was sharpened by strong feelings of nationalism
in a continent that was constantly embroiled in wars.
During the age of colonialism and mercantilism, the nations seeding the world
with colonies were not trying to increase their trade. Most colonies were set up
with an economic system that smacked of feudalism, with their raw goods going
back to the motherland and, in the case of the British colony in America, being
forced to buy the finished product back with a pseudo-currency that prevented
them from trading with other nations.
It was Adam Smith who noticed that
mercantilism was not a force of development and change, but a regressive system
that was keeping the world from advancing. His ideas for a free market opened
the world to capitalism.
Industrial Capitalism and Further
Smith's ideas were well
timed for the world, as the Industrial Revolution was just starting to cause
tremors that would soon shake the world. It was becoming apparent that
colonialism wasn't the gold mine that the European powers thought it would be.
Fortunately, a new gold mine was found in the mechanization of industry. As
technology leaped ahead and the factories no longer had to be built near
waterways to function, industrialists began building in the cities where there
were now thousands of people to supply ready labor.
Industrial tycoons were the first people to amass their wealth in their
lifetimes, outstripping both the landed nobles and many of the
moneylending/banking families. For the first time in history, common people
could have hopes of becoming wealthy without being born into it. The new money
crowd was as rich as the old money crowd, but they had no interest in the status
quo. They built more factories that required more labor while also producing
more goods for people to purchase.
The Bottom Line
Industrial capitalism was the first
system to benefit all levels of society rather than just the noble class. Wages
increased, helped greatly by the formation of unions, and the standard of living
also increased with the glut of affordable products being mass-produced. This
led to the formation of a middle class that began to lift more and more people
from the lower classes to swell its ranks.
All over the world, capitalism grew beyond pure industrial capitalism into
forms more palatable to the region it settled. The U.S. raised one of the purest
types of capitalism with a minimum of government regulation, while Canada and
the Nordic countries created a balance between socialism and capitalism. It took
a long time to get here, but capitalism is here to stay. As the world becomes
more globalized, it is likely that countries who haven't yet adopted this system
will jump on the bandwagon as well.
Thursday, October 13, 2011
The Utility Of Trendlines
Uptrends and downtrends are hot topics among technical analysts and traders, because they ensure that the underlying market conditions are working in favor of a trader's position, rather than against it. Trendlines are easily recognizable lines that traders draw on charts to connect a series of prices together. The resulting line is then used to give the trader a good idea of the direction in which an investment's value might move. In this article, you'll discover how to use this tool. It won't be long before you're drawing them on your own charts to increase your chances of making a successful trade!
Trendline Basics
Understanding the direction of an underlying trend is one of the most basic ways to increase the probability of making a successful trade, because it ensures that the general market forces are working in your favor.
Downward sloping trendlines suggest that there is an excess amount of supply for the security, a sign that market participants have a higher willingness to sell an asset, than to buy it. As you can see in Figure 1, when a downward sloping trendline (black dotted line) is present, you should refrain from holding a long position; a gain on a move higher is unlikely, when the overall longer-term trend is heading downward. Conversely, an uptrend is a signal that the demand for the asset is greater than the supply, and is used to suggest that the price is likely to continue heading upward.
Trendlines can vary drastically, depending on the time frame used and the slope of the line. For example, some securities can show aspects of uptrend/downtrends for months, days or even a few minutes, while others can become range-bound and trade within a sideways trend.
Support and Resistance
Trendlines are a relatively simple tool that can be used to gauge the overall direction of a given asset, but, more importantly, they can also be used by traders to help predict areas of support and resistance. This means that trendlines are used to identify the levels on a chart beyond which the price of an asset will have a difficult time moving. This information can be very useful to traders looking for strategic entry levels or can even be used to effectively manage risk, by identifying areas to place stop-loss orders.
Technical traders pay particularly close attention to an asset when the price approaches a trendline, because these areas often play a major role in determining the short-term direction of the asset's price. As the price nears a major support/resistance level, there are two different scenarios that can occur: The price will bounce off the trendline and continue in the direction of the prior trend, or it will move through the trendline, which can then be used as a sign that the current trend is reversing or weakening.
Drawing Your Own Trendlines
As mentioned earlier, trendlines are simply lines that connect a series of prices to give the trader a better idea of where the price of a particular investment is headed. The problem comes with figuring out which prices are used to create the trendline. As you may know, the open, close, low and high prices are easily obtained for most stocks, but which of these prices should be used when creating a trendline?
There is no one, distinct answer to this question. Technical signals generated by the various technical patterns/indicators are very subjective and trendlines are no exception. It is entirely the trader's decision when it comes to choosing what points are used to create the line and no two traders will always agree to use the same points. Some traders will only connect closing prices while others may choose to use a mix of close, open and high prices. Regardless of the prices being connected, it is important to note that the more prices that touch the trendline the stronger and more influential the line is believed to be.
In general, upward sloping trendlines are used to connect prices that act as support, while the given asset is trending upward. This means that upward sloping trendlines are mainly drawn below the price and connect either a series of closes or period lows. Conversely, a downward sloping trendline is generally used to connect a series of closing prices or period highs, that act as resistance while the given asset is trending downward. This is similar to what is shown in the chart above.
We should note that it is possible to use two trendlines on the same chart. However, this method, known as a channel, goes beyond the scope of this article.
Uptrends and downtrends are hot topics among technical analysts and traders, because they ensure that the underlying market conditions are working in favor of a trader's position, rather than against it. Trendlines are easily recognizable lines that traders draw on charts to connect a series of prices together. The resulting line is then used to give the trader a good idea of the direction in which an investment's value might move. In this article, you'll discover how to use this tool. It won't be long before you're drawing them on your own charts to increase your chances of making a successful trade!
Trendline Basics
Understanding the direction of an underlying trend is one of the most basic ways to increase the probability of making a successful trade, because it ensures that the general market forces are working in your favor.
Downward sloping trendlines suggest that there is an excess amount of supply for the security, a sign that market participants have a higher willingness to sell an asset, than to buy it. As you can see in Figure 1, when a downward sloping trendline (black dotted line) is present, you should refrain from holding a long position; a gain on a move higher is unlikely, when the overall longer-term trend is heading downward. Conversely, an uptrend is a signal that the demand for the asset is greater than the supply, and is used to suggest that the price is likely to continue heading upward.
 |
| Figure 1 |
Trendlines can vary drastically, depending on the time frame used and the slope of the line. For example, some securities can show aspects of uptrend/downtrends for months, days or even a few minutes, while others can become range-bound and trade within a sideways trend.
Support and Resistance
Trendlines are a relatively simple tool that can be used to gauge the overall direction of a given asset, but, more importantly, they can also be used by traders to help predict areas of support and resistance. This means that trendlines are used to identify the levels on a chart beyond which the price of an asset will have a difficult time moving. This information can be very useful to traders looking for strategic entry levels or can even be used to effectively manage risk, by identifying areas to place stop-loss orders.
Technical traders pay particularly close attention to an asset when the price approaches a trendline, because these areas often play a major role in determining the short-term direction of the asset's price. As the price nears a major support/resistance level, there are two different scenarios that can occur: The price will bounce off the trendline and continue in the direction of the prior trend, or it will move through the trendline, which can then be used as a sign that the current trend is reversing or weakening.
Drawing Your Own Trendlines
As mentioned earlier, trendlines are simply lines that connect a series of prices to give the trader a better idea of where the price of a particular investment is headed. The problem comes with figuring out which prices are used to create the trendline. As you may know, the open, close, low and high prices are easily obtained for most stocks, but which of these prices should be used when creating a trendline?
There is no one, distinct answer to this question. Technical signals generated by the various technical patterns/indicators are very subjective and trendlines are no exception. It is entirely the trader's decision when it comes to choosing what points are used to create the line and no two traders will always agree to use the same points. Some traders will only connect closing prices while others may choose to use a mix of close, open and high prices. Regardless of the prices being connected, it is important to note that the more prices that touch the trendline the stronger and more influential the line is believed to be.
In general, upward sloping trendlines are used to connect prices that act as support, while the given asset is trending upward. This means that upward sloping trendlines are mainly drawn below the price and connect either a series of closes or period lows. Conversely, a downward sloping trendline is generally used to connect a series of closing prices or period highs, that act as resistance while the given asset is trending downward. This is similar to what is shown in the chart above.
We should note that it is possible to use two trendlines on the same chart. However, this method, known as a channel, goes beyond the scope of this article.
Index Investing Isn't Exciting, But It Works
Zig Ziglar quips that hurricanes and earthquakes get the headlines, although termites do more damage than hurricanes and earthquakes combined.The number of car accident fatalities in Texas in an average month is the equivalent loss of life as the crash each month of a full commercial airliner with the loss of all aboard. Who doubts that there would be a public outcry for immediate improved aviation safety if a large commercial airliner went down in Texas every month? But where’s the public outcry about the tragedies on the state’s roads?
News coverage of a billionaire often is solely about his or her wealth. A billionaire has one hundred times the wealth of a person with a net worth of ten million dollars. However, press coverage about the billionaire's wealth is orders of magnitude more than the difference in wealth between the two people.
The point: Visibility distorts proportionality in public attention. So do precipitousness and conflict.
Reading business and financial news can leave the impression that nearly everyone and their brother -- especially if perceived as sophisticated -- are investing in private equity, hedge funds, commodities, other “alternatives,” and complicated trading strategies. And frequently stock picking and trading, selecting the "best" investment managers, playing the IPO market, and the like. For example, The New York Times' "Dealbook” -- which has excellent content, by the way -- has the latest and greatest on these topics: private equity, hedge funds, M&A, securities offerings, investment banking, and venture capital. There’s drama with these topics: triumph, failure, redemption, and other sagas. And adrenaline rushes. Heat, smoke, sizzle.
So-called passive investing -- low cost, index fund investing -- by contrast, is boring. Losing or making a fortune quickly with index investing is difficult. Where’s the excitement, the news, in that? A typical person perusing mass-market financial publications would think that index investing isn't in the game.
But it is. $6 trillion is invested in indexed assets, representing a value increase of almost 25% last year. And the trend for indexing, especially for institutional investors seeking worldwide equity exposure, is good. The reasons for the trend include lower risk, a desire for liquidity, the avoidance of subpar active performance, and, of course, the cost advantage. "Nothing is cheaper than beta exposure, delivered through index funds."
The more attention an investment class receives from the financial press, the more lucrative that class is for "financial services industry professionals" (or, to use Warren Buffett's word, "helpers"). And the less likely the class is to produce acceptable, risk-adjusted returns in the long term.
A prediction: In not too many years, the great debate about active management versus indexing will have evolved. The two opposing viewpoints will then be whether investment return optimization is achieved via indexing as the core strategy, complemented by alternatives, or whether indexing is the only strategy
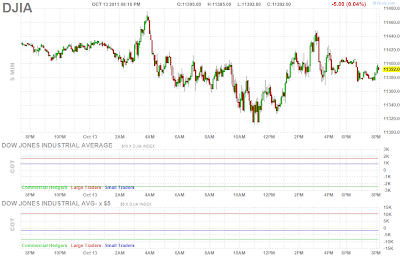
The market made a boring move most of the trading day today except late in the afternoon where it climbed up to beat its opening price.
It's a battle between the two protagonist wherein the bears lost its control late in the trading day.
The only probable trade to spot is after the lunch break where the tight consolidation took its place.
It might be a see saw battle again tomorrow Friday, a profit taking day. Expect some volatility.
The best play tomorrow is to stay on the sideline or take a break from trading.

Subscribe to:
Posts (Atom)